Spans view
The Spans tab lists every span in the selected trace in execution order. It surfaces the hierarchy, duration, and key metadata so you can see which services participated and how long each step took.
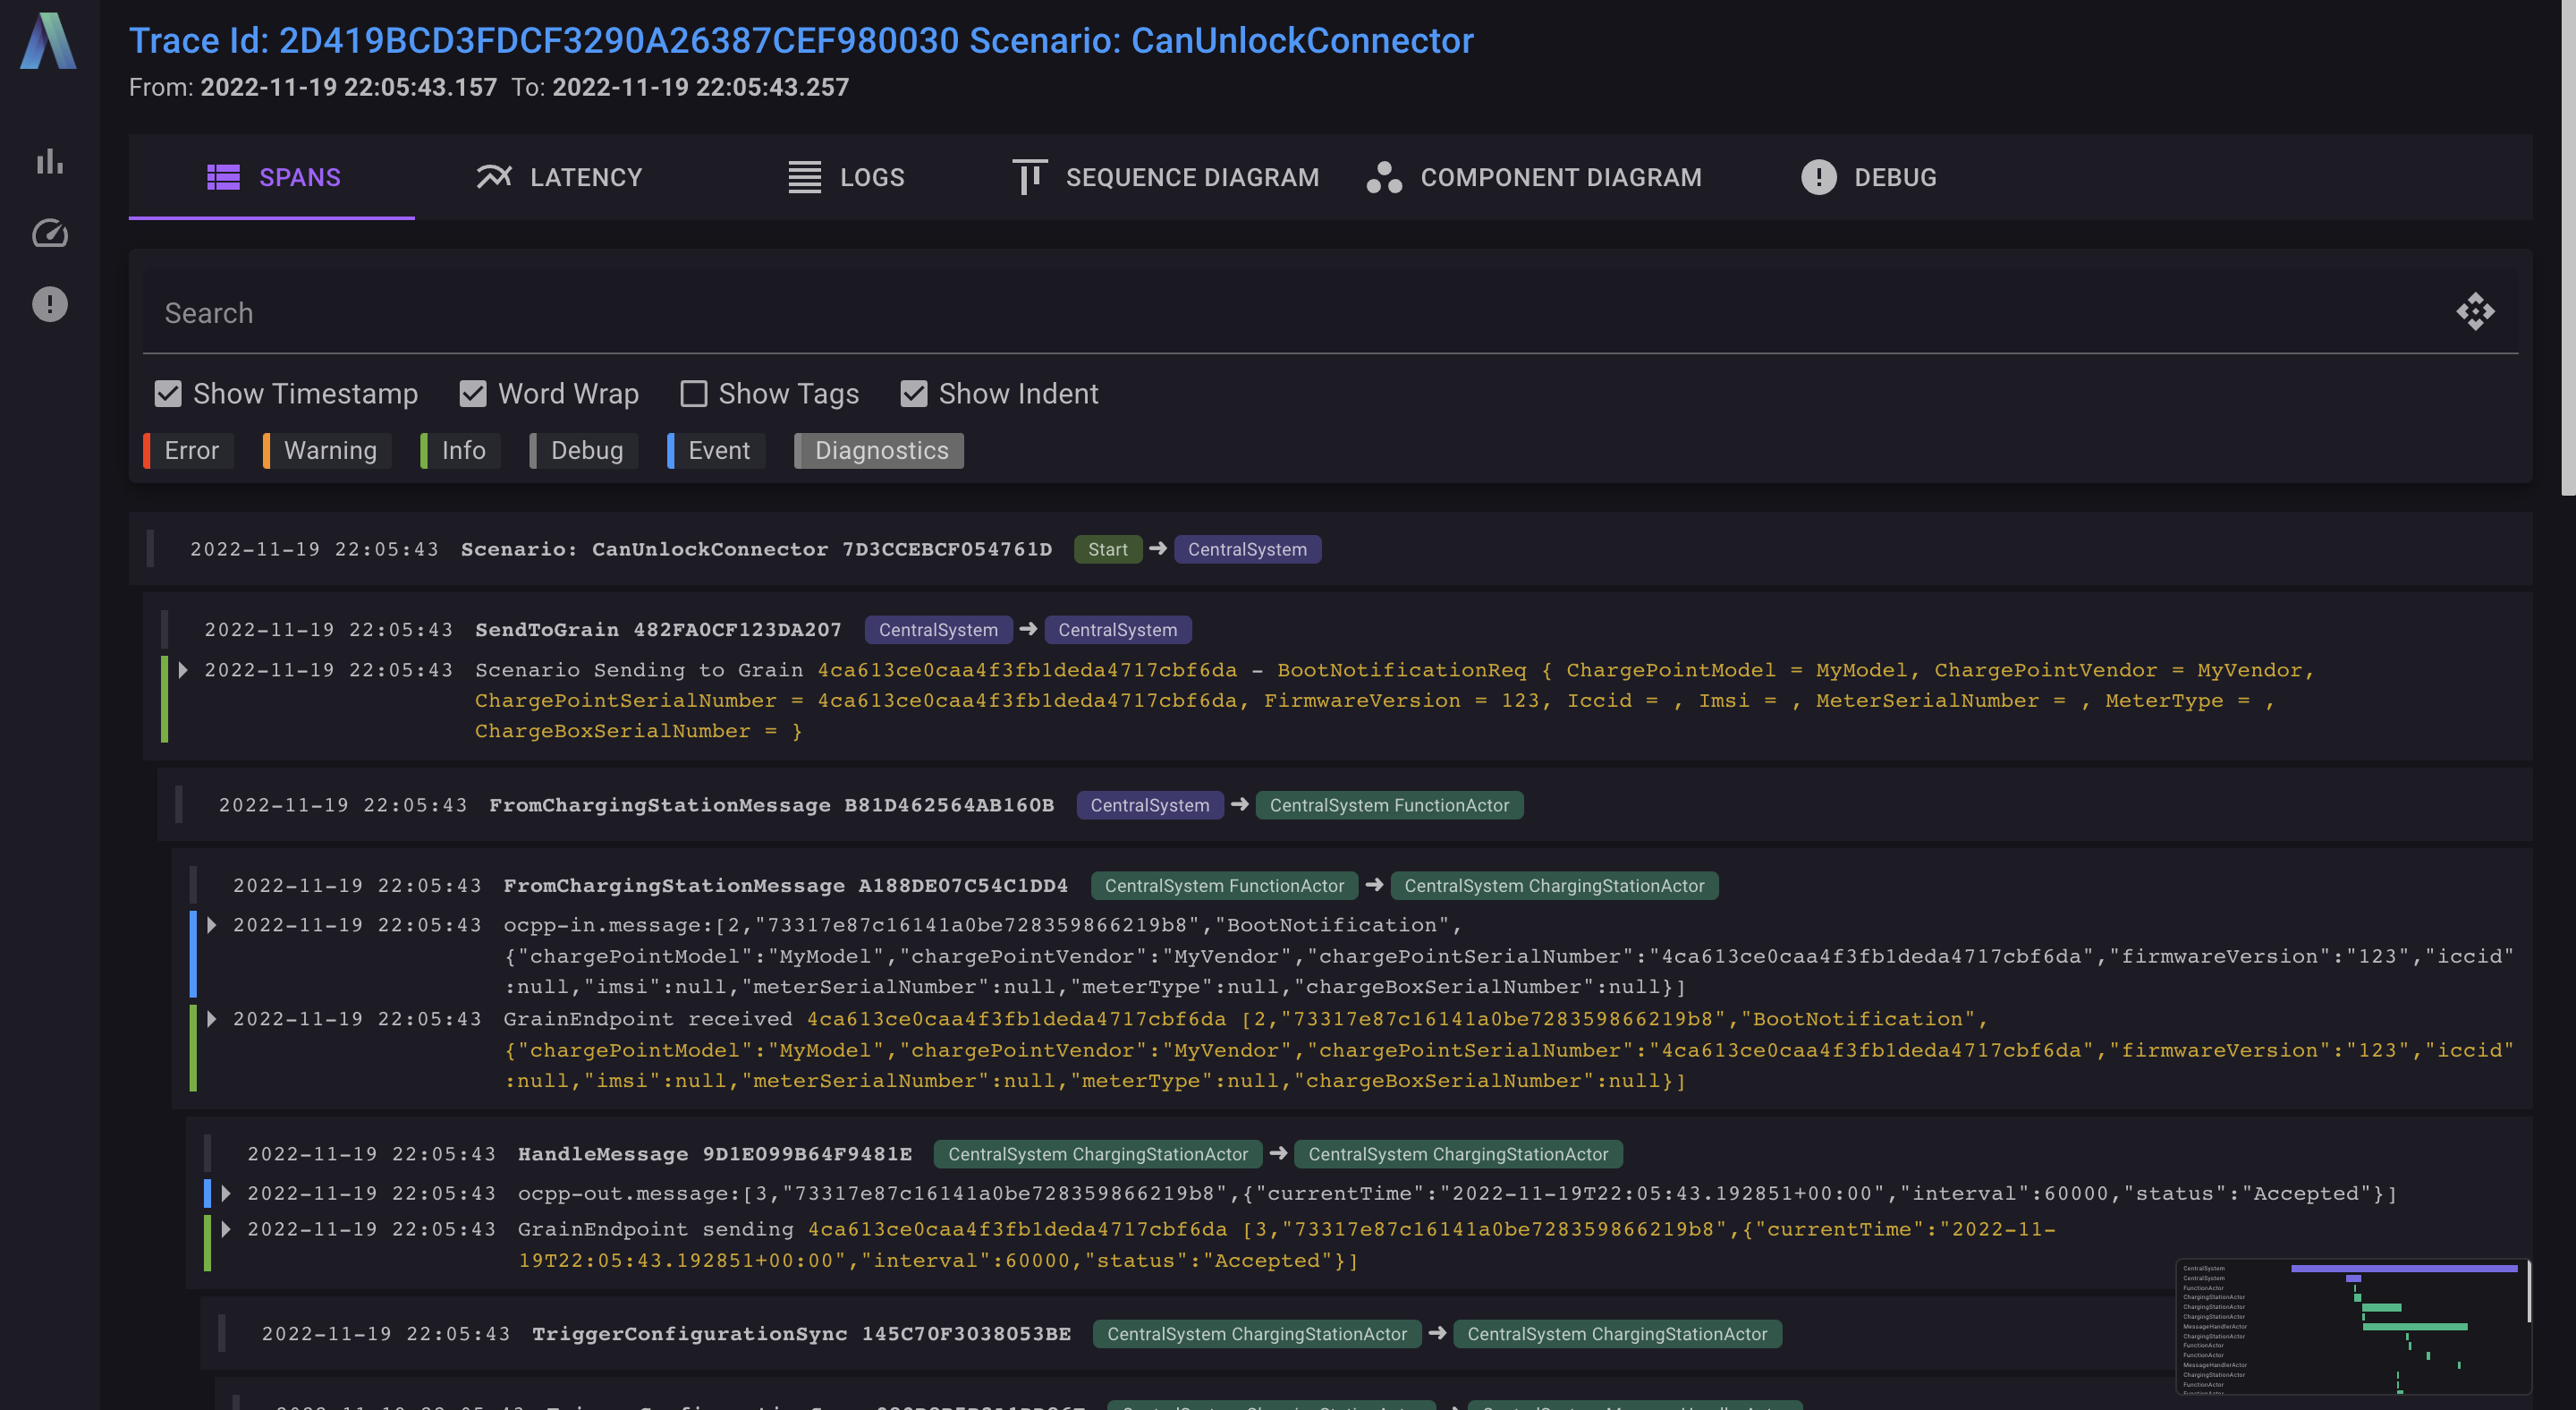
What to look for
- Service column. The left-most column shows the service or actor that emitted the span. Indentation reflects parent/child relationships so you can follow nested calls.
- Timeline ruler. Durations are shown inline, making it easy to identify outliers or confirm that downstream work is parallelized as expected.
- Span metadata. Toggle “Show Tags” to reveal attached attributes (for example request identifiers or payload hints) without leaving the list.
- Severity toggles. Enable or disable error, warning, info, debug, and event signals so that the table highlights the problems you care about.
Use the spans list as a jumping-off point before moving to the timeline, logs, or diagram-centric tabs.