Logs view
The Logs tab overlays log entries on top of the current trace so you can correlate spans with textual diagnostics.
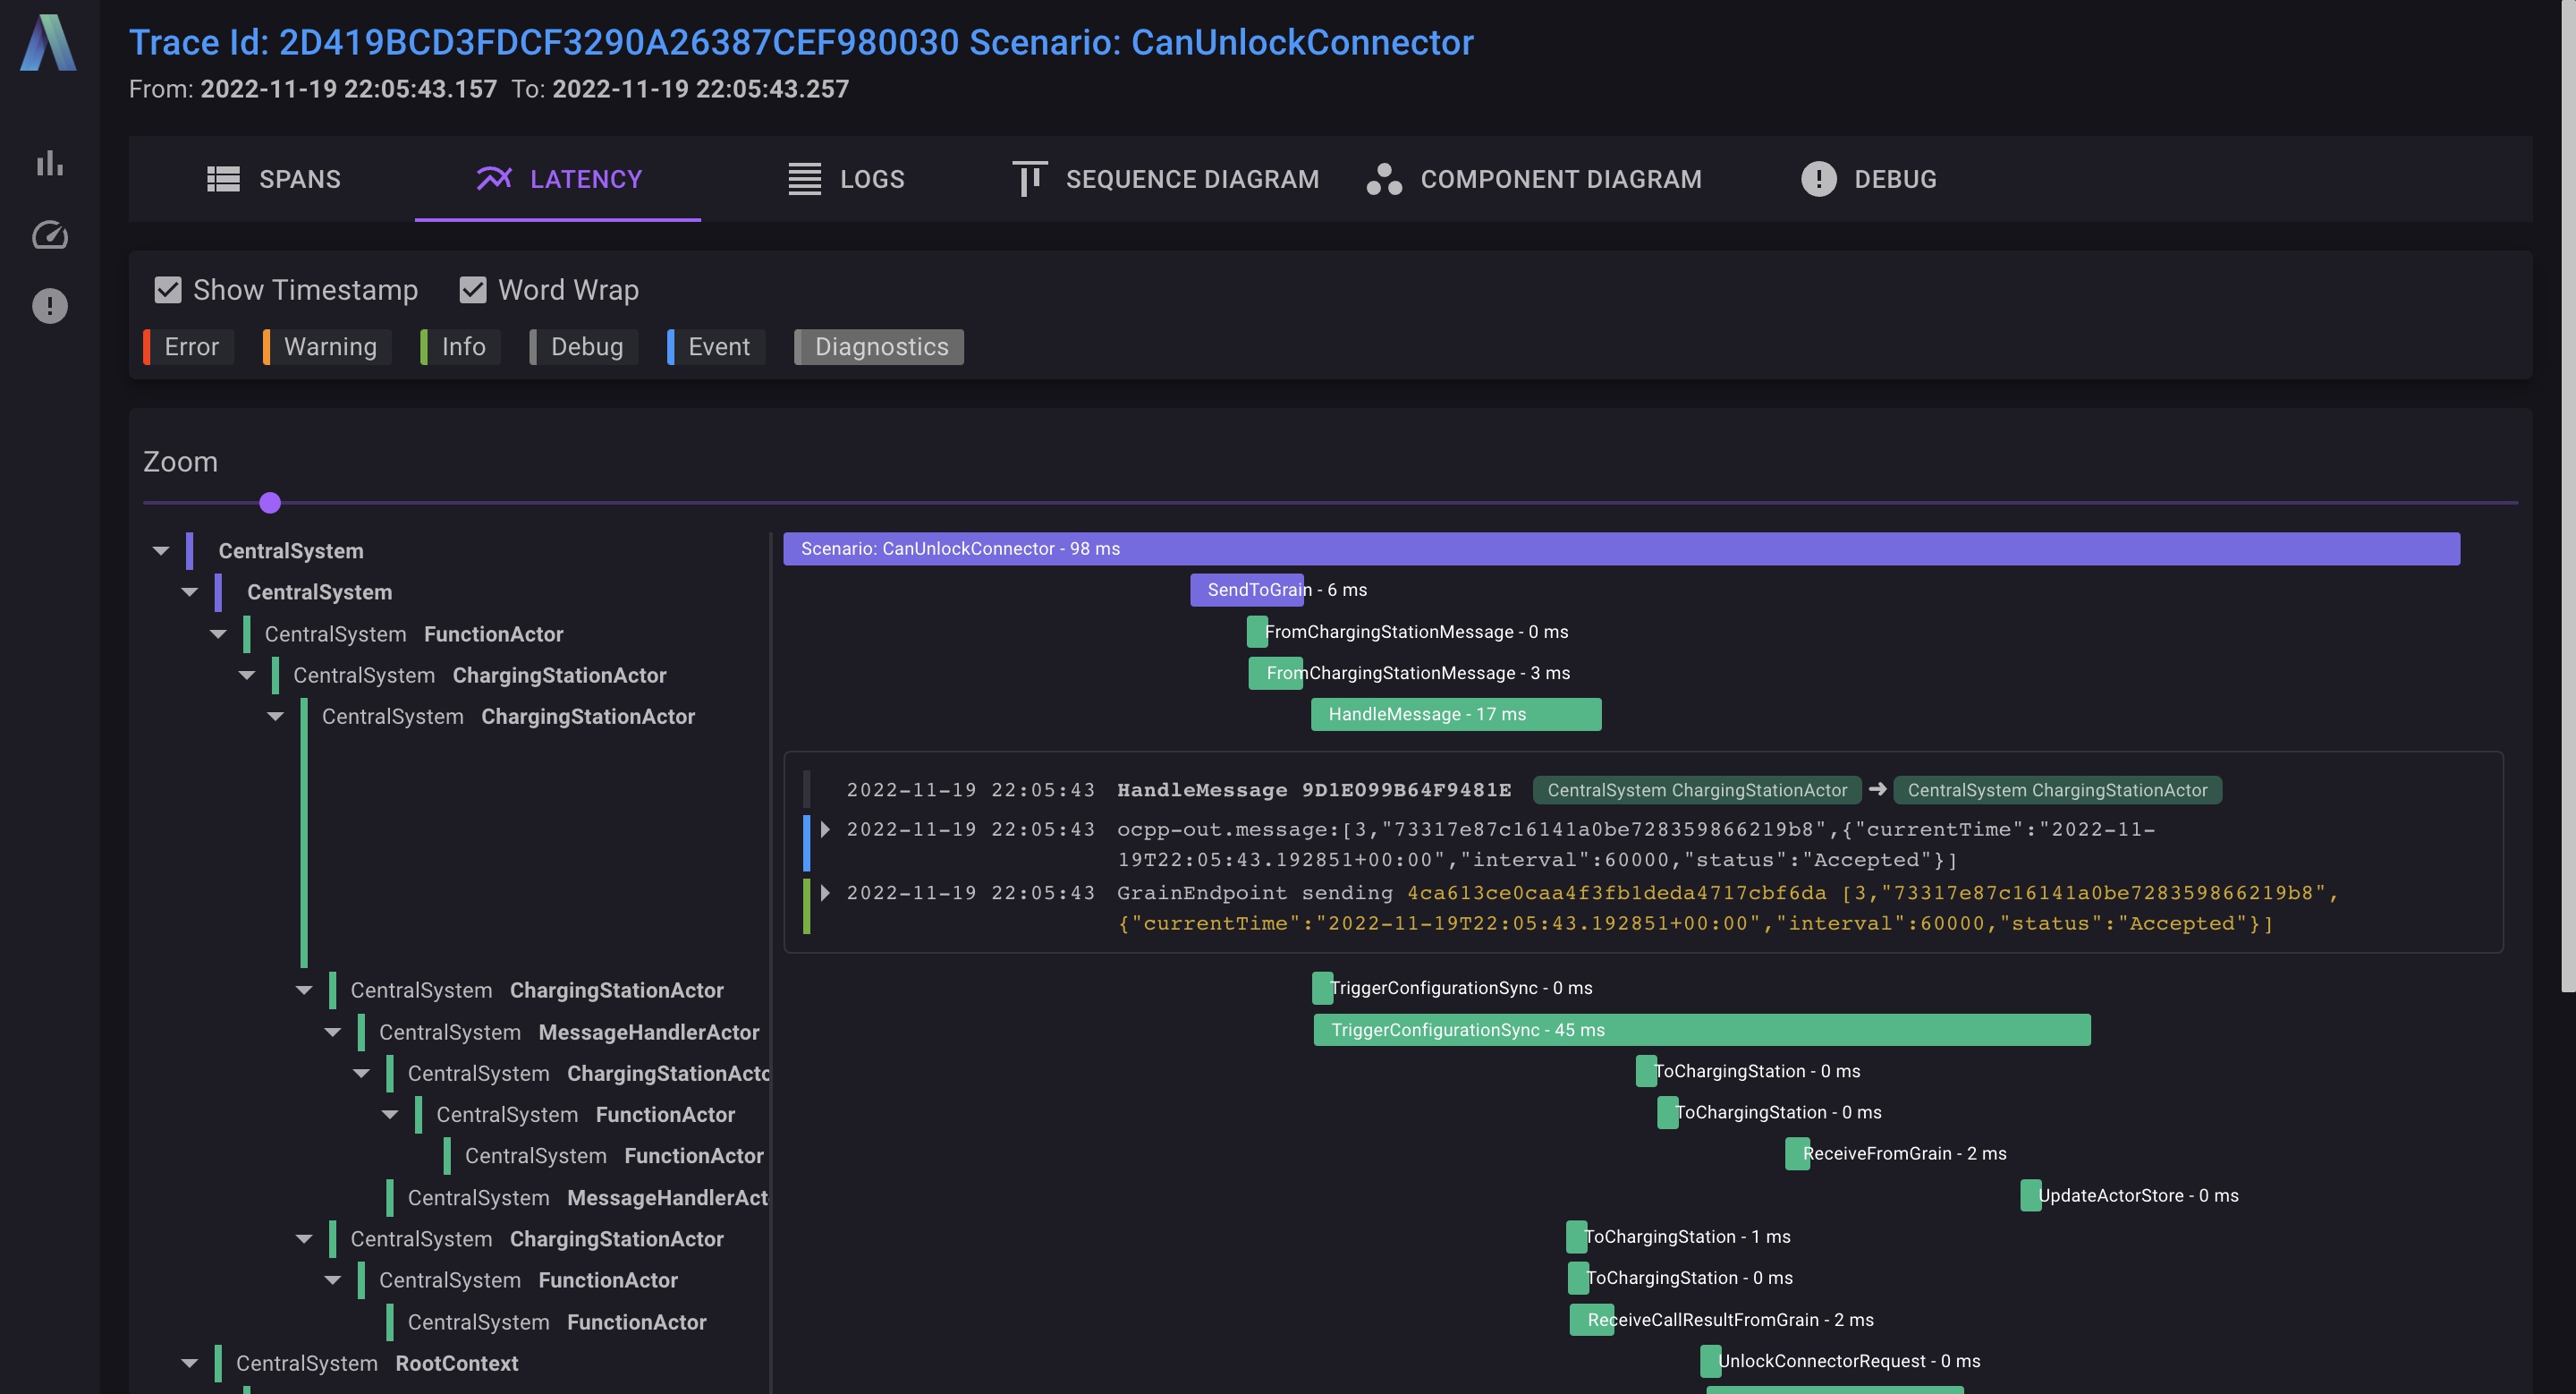
Why it matters
- Severity filters across the top toggle error, warning, info, debug, and event entries. Narrow the feed to the signals that matter for your investigation.
- Indent and timestamp switches adjust the formatting, making JSON payloads or multi-line logs easier to read.
- Span-scoped grouping keeps each message aligned with the span that emitted it, so you always know which component produced the log.
- Quick search helps you jump to correlation IDs, exception messages, or business keywords without leaving the page.
When you see suspicious delays or failures in the span list, open the Logs tab to capture the textual evidence that explains what happened.