TraceLens
TraceLens is an OpenTelemetry-focused tracing and logging visualizer that also ships with a built-in collector so you can ingest and inspect telemetry from one container. It is published as a beta and is currently free for all users; after the beta concludes it will remain free for personal and open-source projects while commercial use is expected to require a subscription. Because the product is still in beta, the End User License Agreement highlights that the software is provided “as is” and forbids reverse engineering or derivative works.
Project links
- Official site: tracelens.io
- Source repository: asynkron/TraceLens
What TraceLens provides
- Collector and UI in a single image. The Docker image exposes the web experience on port
5001and an OTLP gRPC endpoint on4317, making it easy to point your applications at TraceLens without deploying a separate collector. - Diagram-friendly analysis. When you run the official Docker Compose file, TraceLens launches a PlantUML container so sequence and component diagrams render locally instead of leaving your network. If you prefer the standalone container you can point the UI at an internal PlantUML server by setting
PlantUml__RemoteUrl. - Bring-your-own storage. Telemetry is persisted in the PostgreSQL database you configure. In the Docker Compose stack a local PostgreSQL container is provisioned for you, while the standalone image accepts a custom connection string via
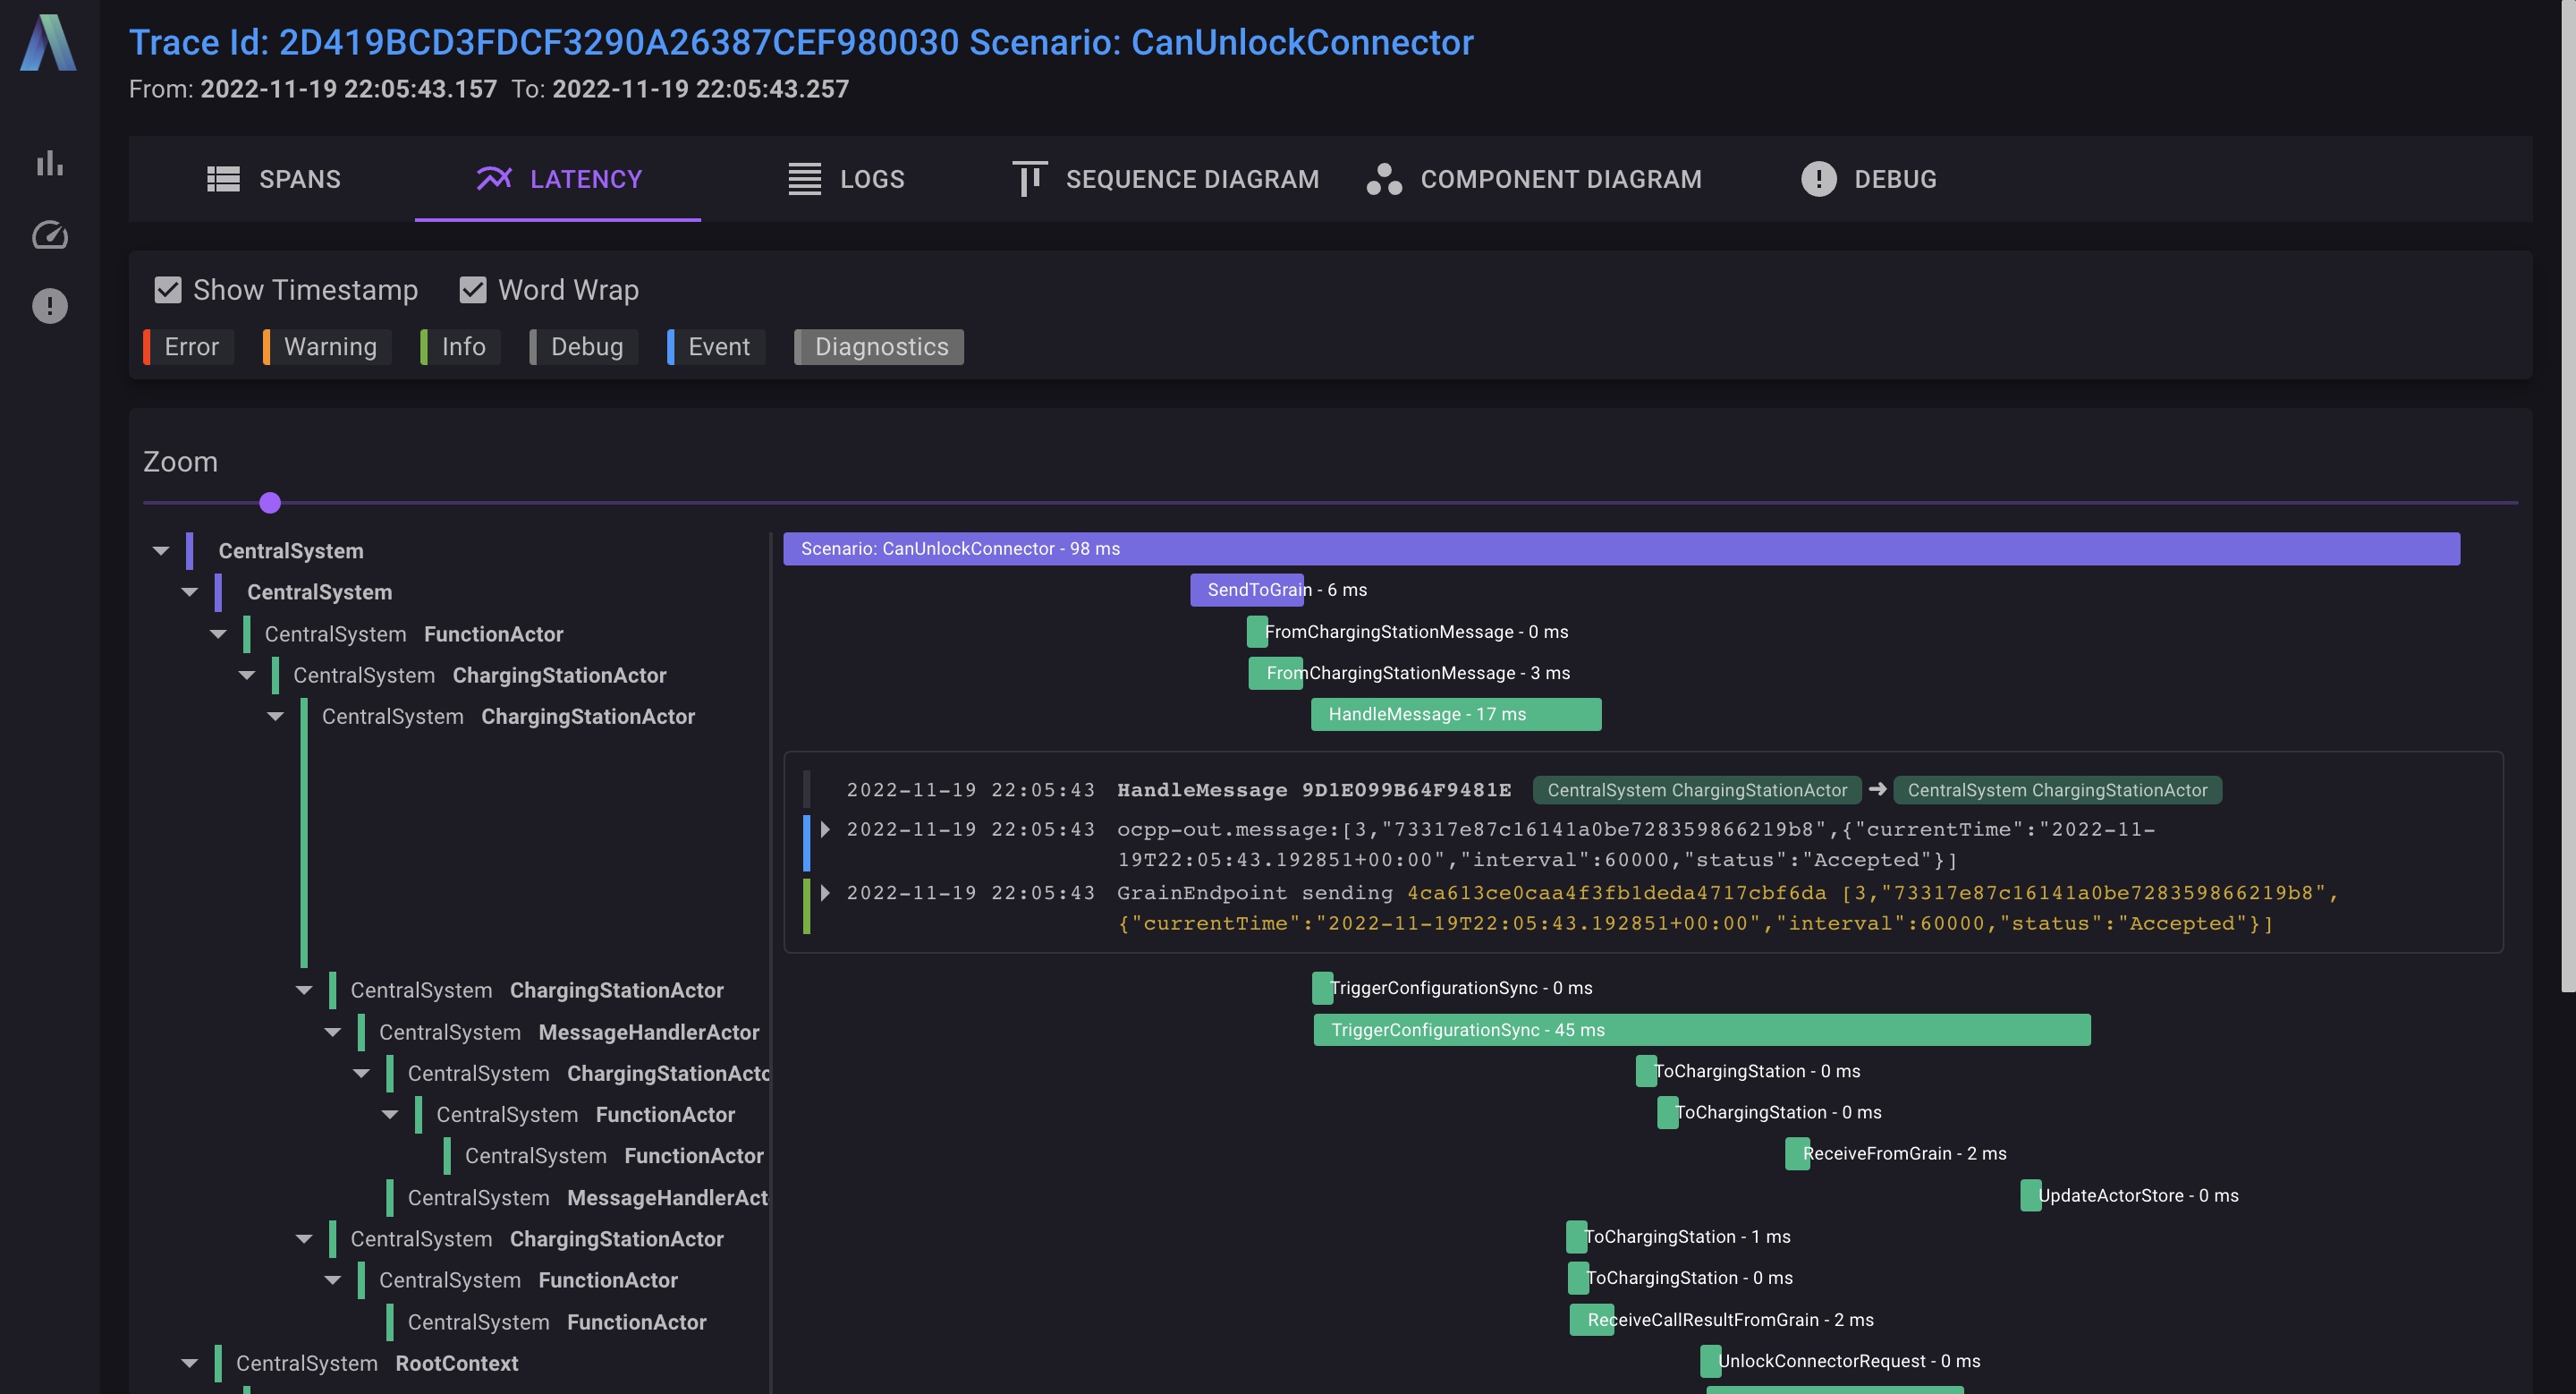
ConnectionStrings__DefaultConnection. - Deep trace diagnostics. The UI includes span lists, timeline visualizations, log overlays, UML sequence diagrams, and component diagrams that surface how services collaborate inside a trace.
Use the rest of this section to deploy TraceLens, integrate it with .NET Aspire projects, and dive into the UI views to understand the tooling that ships in the box.